Getting Started
The following guide will help you to get started using Connect. Once you have your project ID and API key and you have decided how to model your events, you can start pushing events and executing queries.
Installing the SDK
The JavaScript SDK can be installed in a number of different ways, depending on your environment and use case.
CDN
You can easily reference the SDK for browser apps by including it from our CDN. Simple copy and paste the following script into your page:
<script src="https://cdn.getconnect.io/connect-js/{x.x.x}/standalone/connect-all.min.js"></script>
To take advantage of the visualizations provided, you must also reference the CSS (this is not required if you simply wish to push events using the SDK):
<link href="https://cdn.getconnect.io/connect-js/{x.x.x}/standalone/connect-all.min.css" rel="stylesheet" />
For more info on visualization, see visualizing data.
NPM
If you are writing a Node.js app, or using NPM packages in the browser with something like Browserify, you can install the package from NPM:
npm install connect-js
You would then require the SDK as follows:
var Connect = require('connect-js');
For browser apps, you can also install the visualization package:
npm install connect-js-viz
When using the visualization, you only need to require the viz package and all other functionality is included:
var Connect = require('connect-js-viz');
For more info on visualization, see visualizing data.
Bower
You can easily install the SDK from Bower:
bower install connect-js
Creating the client
Before you can start pushing events, executing queries or visualizing data, you must create a Connect client with your project ID and API key:
var connect = new Connect({
    projectId: 'YOUR_PROJECT_ID',
    apiKey: 'YOUR_API_KEY'
});
Each client is specific to a particular project - if you wish to push to or query multiple projects, simply create multiple clients.
Pushing events
Once you have created a client, you can start pushing events easily.
Single event
To push a single event into a collection simply call the push function on the Connect object and pass in the collection name and the event itself.
connect.push('purchases', {
    name: 'Phone',
    price: 465.55
})
.then(function () {
    // Handle the response

})
.catch(function (error) {
    // Handle the error

});
Responses
200 OK
The event has been successfully recorded.
422 Unprocessable Entity
One or more errors have occurred with the event data sent.
{
    "errors": [
        { "field": "fieldName", "description": "There was an error with this field." }
    ]
}
413 Request Too Large
The event was to large. Single events cannot be larger than 64kb.
{
    "errorMessage": "Maximum event size of 64kb exceeded."
}
400 Bad Request
The event data supplied is not valid.
{
    "errorMessage": "Property names starting with tp_ are reserved and cannot be set."
}
500 Internal Server Error
A server error occurred with the Connect API.
{
    "errorMessage": "An error occurred while processing your request"
}
Multiple events
To push two or more events into a single collection call the push function on the Connect object and pass in the collection name and an array of the events.
connect.push('purchases', [
    {
        name: 'Phone',
        price: 465.55
    },
    {
        name: 'Case',
        price: 5.55
    }
])
.then(function (response) {
    // Handle the response

})
.catch(function (error) {
    // Handle the error

});
A possible response to the above example could be:
{
    "purchases": [
        {
            "success": true
        },
        {
            "success": false,
            "message": "An error occured inserting the event please try again."
        }
    ]
}
Batches of events
You can also push multiple events to multiple collections in a single call by passing an object with arrays of events keyed by collection name.
connect.push({
    "purchases": [
        {
            "customer": {
                "firstName": "Tom",
                "lastName": "Smith"
            },
            "id": "1849506679",
            "product": "12 red roses",
            "purchasePrice": 34.95
        },
        {
            "customer": {
                "firstName": "Jane",
                "lastName": "Doe"
            },
            "id": "123456",
            "product": "1 daisy",
            "purchasePrice": 8.95
        }
    ],
    "refunds": [
        {
            "customer": {
                "firstName": "Tom",
                "lastName": "Smith"
            },
            "id": "REF-1234",
            "product": "12 red roses",
            "purchasePrice": -34.95
        }
    ]
})
.then(function (response) {
    // Handle the response

})
.catch(function (error) {
    // Handle the error

});
Batch responses
200 OK
An example response for the above request could be:
{
    "purchases": [
        {
            "success": true
        },
        {
            "success": false,
            "message": "An error occurred inserting the event please try again."
        }
    ],
    "refunds": [
        {
            "success": true
        }
    ]
}
500 Internal Server Error
A server error occurred with the Connect API.
{
    "errorMessage": "An error occurred while processing your request"
}
Bulk importing events
Currently, this SDK does not support bulk importing events.
However, you can use the HTTP API to run bulk imports if you need.
Restrictions on pushing
There are a number of restrictions on the properties you can use in your events and the limitations on querying which influences how you should structure your events.
Refer to restrictions in the modeling your events section.
Reliability of events
Currently, it is not possible to persist/queue events for delivery in the JavaScript SDK. Pushing events performs a simple, asynchronous operation to push the event.
In a browser, this means you cannot guarantee the delivery of events successfully.
In a Node.js app, you may want to consider create queues for your events to ensure they are delivered reliably.
Events also allow a custom ID to be sent in the event document which will prevent duplicates (i.e. guarantees idempotence even if the event is delivered multiple times). For example:
{
    "customer": {
        "firstName": "Tom",
        "lastName": "Smith"
    },
    "id": "1849506679",
    "product": "12 red roses",
    "purchasePrice": 34.95
}
Timestamps
All events have a single timestamp property which records when the event being pushed occurred. Events cannot
have more than one date/time property. If you feel you need more than one date/time property, you probably need
to reconsider how you're modeling your events.
Querying
You can only run time interval queries or timeframe filters on the
timestampproperty. No other date/time property in an event is supported for querying.
By default, if no timestamp property is sent with the event, Connect will use the current date and time as
the timestamp of the event.
The timestamp, however, can be overridden to, for example, accommodate historical events or maintain accuracy of event times when events are queued.
The timestamp must be supplied as an ISO-8601 formatted date. The date must be in UTC (you cannot specify a timezone offset). For example:
{
    "customer": {
        "firstName": "Tom",
        "lastName": "Smith"
    },
    "timestamp": "2015-02-05T14:55:56.587Z",
    "product": "12 red roses",
    "purchasePrice": 34.95
}
Timezones
Timestamps are always recorded in UTC. If you supply a timestamp in a timezone other than UTC, it will be converted to UTC. When you query your events, you can specify a timezone so things like time intervals will be returned in local time.
Querying events
Using the SDK, you can construct and execute queries client-side and receive a promise to the results.
Once you have created a client with a valid read key, you can start querying your collections immediately.
For example, to get the sum of the price property in a collection called purchases, you would execute the following query:
connect.query("purchases")
    .select({ "totalPrice": { "sum": "price" } })
    .execute()
    .then(function(result) {
        // Handle the result
    }, function(error) {
      // Handle an error
    });
Metadata
The query results return metadata on the executed query. This includes any groups used, the time interval, if specified, and the timezone, if specified, for the query.
For example, if you grouped by product, with a daily time interval and a timezone of Australia/Brisbane, the metadata would look like:
{
    "groups": ["product"],
    "interval": "daily",
    "timezone": "Australia/Brisbane"
}
Metadata is used by our Visualization SDK to discover the shape of your query so that we can easily display the results. If you're doing your own visualization, you can take advantage of the metadata as hints on how to render the results.
Aggregations
You can perform various aggregations over events you have pushed. Simply specify in the query's select which properties you wish to aggregate and which aggregation you wish to use. You also must specify an "alias" for the result set that is returned.
For example, to query the purchases collection and perform aggregations on the price event property::
connect.query("purchases")
    .select({
        "itemsSold": "count",
        "totalPrice": { "sum": "price" },
        "averagePrice": { "avg": "price" },
        "minPrice": { "min": "price" },
        "maxPrice": { "max": "price" }
    })
    .execute()
    .then(function(result) {
        // Handle the result
    });
This would return a result like:
{
    "metadata": {
        "groups": [],
        "interval": null,
        "timezone": null
    },
    {
        "itemsSold": 25,
        "totalPrice": 5493.25,
        "averagePrice": 219.73,
        "minPrice": 5.49,
        "maxPrice": 589.20
    }
}
The following aggregations are supported:
- count
- sum
- avg
- min
- max
Limitations
- Aggregations only work on numeric properties. If you try to aggregate a string property, you will receive a null result. If you try to aggregate a property with multiple types (e.g. some strings, some numbers), only the numeric values will be added - the rest are ignored.
Filters
You can filter the events you wish to include in your queries by specifying one or more filters. For example:
connect.query("purchases")
    .select({
        "totalPrice": { "sum": "price" }
    })
    .filter({
        "product": "12 red roses"
    })
    .execute()
    .then(function(result) {
        // Handle the result
    });
The above will filter the query results for only those events that have a product property equalling "12 red roses".
The above is also shorthand for the eq operator. To illustrate this, the following is identical to the above:
connect.query("purchases")
    .select({
        "totalPrice": { "sum": "price" }
    })
    .filter({
        "product": { "eq": "12 red roses" }
    })
    .execute()
    .then(function(result) {
        // Handle the result
    });
The following match operators are currently supported:
- eq (equal to)
- neq (not equal to)
- gt (greater than)
- gte (greater than or equal to)
- lt (less than)
- lte (less than or equal to)
- exists (whether or not a property exists)
- startsWith (starts with - string values only)
- endsWidth (ends with - string values only)
- contains (contains - string values only)
- in (property is one of a list of values)
Exists filter
The exists filter will filter the query results for only events that either have or don't have the specified property and where the specified property is or isn't null respectively. You supply a boolean value with the exists operator to specify whether to include or exclude the events.
Missing properties vs null values
We treat missing properties and properties with a null value the same for the purpose of the exists filter. While we plan to change this behavior in the future, you should consider setting a default value as opposed to a null value on properties if you wish to make a distinction.
For example, the following will filter for events that have a property called gender:
connect.query("purchases")
    .select({
        "totalPrice": { "sum": "price" }
    })
    .filter({
        "gender": { "exists": true }
    })
    .execute()
    .then(function(result) {
        // Handle the result
    });
Whereas the following will filter for events that do not have a property called gender:
connect.query("purchases")
    .select({
        "totalPrice": { "sum": "price" }
    })
    .filter({
        "gender": { "exists": false }
    })
    .execute()
    .then(function(result) {
        // Handle the result
    });
In filter
The in filter allows you to specify a list of values for which a property should match.
For example, the following will filter for events that have a category of either "Bikes", "Books" or "Magazines":
connect.query("purchases")
    .select({
        "totalPrice": { "sum": "price" }
    })
    .filter({
        "category": { "in": ["Bikes", "Books", "Magazines"] }
    })
    .execute()
    .then(function(result) {
        // Handle the result
    });
Note: All values in the list must be of the same type (i.e. string, numeric or boolean). Mixed types are currently not supported.
Combining filter expressions
You can also combine filter expressions to filter multiple values on the same property.
For example, the following will filter for events with a price property greater than 5 but less than 10:
connect.query("purchases")
    .select({
        "totalPrice": { "sum": "price" }
    })
    .filter({
        "price": { "gt": 5, "lt": 10 }
    })
    .execute()
    .then(function(result) {
        // Handle the result
    });
"Or" filters
Currently, "or" filters are not supported.
Timeframes
You can restrict query results by specifying the timeframe for the query which will filter for events only within that specific timeframe.
If no timeframe is specified, events will not be filtered by time; the query will match events from all time.
For example, the following query filters for events only for this month:
connect.query("purchases")
    .select({
        "totalPrice": { "sum": "price" }
    })
    .timeframe("this_month")
    .execute()
    .then(function(result) {
        // Handle the result
    });
There are two types of timeframes:
- Relative timeframes - a timeframe relative to the current date and time.
- Absolute timeframes - a timeframe between two specific dates and times.
Relative timeframes
Relative timeframes can be specified as either a string or a complex type containing exact numbers of "periods" to filter.
Timezones
By default, all relative timeframes are UTC by default. See the timezone section to specify your own timezone.
The following are supported string timeframes:
- this_minute
- last_minute
- this_hour
- last_hour
- today
- yesterday
- this_week
- last_week
- this_month
- last_month
- this_quarter
- last_quarter
- this_year
- last_year
You can also specify exactly how many current/previous periods you wish to include in the query results.
For example, if you want to filter by the today and the last 2 days:
connect.query("purchases")
    .select({
        "totalPrice": { "sum": "price" }
    })
    .timeframe({ "current": { "days": 3 } })
    .execute()
    .then(function(result) {
        // Handle the result
    });
Or, to filter by the last 2 months, excluding the current month:
connect.query("purchases")
    .select({
        "totalPrice": { "sum": "price" }
    })
    .timeframe({ "previous": { "months": 2 } })
    .execute()
    .then(function(result) {
        // Handle the result
    });
The following periods are supported for complex, relative timeframes:
- minutes
- hours
- days
- weeks
- months
- quarters
- years
Weeks
Our weeks start on a Sunday and finish on a Saturday. In the future, we plan to support specifying on which day of the week you'd like to start your weeks.
Absolute timeframes
You can specify an absolute timeframe by constructing an object with the start and end properties set to the desired start and end times in ISO-8601 format.
For example:
connect.query("purchases")
    .select({
        "totalPrice": { "sum": "price" }
    })
    .timeframe({ "start": "2015-02-01T00:00:00.000Z", "end": "2015-02-25T00:00:00.000Z" })
    .execute()
    .then(function(result) {
        // Handle the result
    });
You can also set the start end end properties to Date objects, for example:
connect.query("purchases")
    .select({
        "totalPrice": { "sum": "price" }
    })
    .timeframe({ "start": new Date(2015, 2, 1), "end": new Date(2015, 2, 25) })
    .execute()
    .then(function(result) {
        // Handle the result
    });
You can only specify a timezone and an absolute timeframe when you have also specified a time interval. If a timezone is specified on an absolute timeframe query that does not have a time interval an error will occur.
Group by
You can group the query results by one or more properties from your events.
Missing properties vs null values
We treat missing properties and properties with a null value the same for the purpose of grouping. This means that all events with a null value for a property or missing that property altogether will be grouped into the "null" value for that query. While we plan to change this in the future, you should consider setting a default value as opposed to a null value on properties if you wish to make a distinction.
For example, to query total sales by country:
connect.query("purchases")
    .select({
        "totalPrice": { "sum": "price" }
    })
    .groupBy("country")
    .execute()
    .then(function(result) {
        // Handle the result
    });
This would return a result like:
{
    "metadata": {
        "groups": ["country"],
        "interval": null,
        "timezone": null
    },
    "results": [{
        "country": "Australia",
        "totalPrice": 1000000
    },
    {
        "country": "Italy",
        "totalPrice": 2500000
    },
    {
        "country": "United States",
        "totalPrice": 10000000
    }]
}
Grouping by multiple properties
You can also group by multiple properties in your events by providing multiple property names.
For example, to query total sales by country and product category:
connect.query("purchases")
    .select({
        "totalPrice": { "sum": "price" }
    })
    .groupBy(["country", "product.category"])
    .execute()
    .then(function(result) {
        // Handle the result
    });
This would return a result like:
{
    "metadata": {
        "groups": ["country", "product.category"],
        "interval": null,
        "timezone": null
    },
    "results": [{
        "country": "Australia",
        "product.category": "Bikes",
        "totalPrice": 500000
    },
    {
        "country": "Australia",
        "product.category": "Cars",
        "totalPrice": 500000
    },
    {
        "country": "Italy",
        "product.category": "Scooters",
        "totalPrice": 2500000
    },
    {
        "country": "United States",
        "product.category": "Mobile Phones",
        "totalPrice": 8000000
    },
    {
        "country": "United States",
        "product.category": "Laptops",
        "totalPrice": 2000000
    }]
}
Time intervals
Time intervals allow you to group results by a time period, so that you could analyze your events over time.
For example, to query daily total sales this month:
connect.query("purchases")
    .select({
        "totalPrice": { "sum": "price" }
    })
    .timeframe("this_month")
    .interval("daily")
    .execute()
    .then(function(result) {
        // Handle the result
    });
This would return a result like:
{
    "metadata": {
        "groups": [],
        "interval": "daily",
        "timezone": null
    },
    "results": [{
        "interval": { "start": "2015-02-01T00:00:00Z", "end": "2015-02-02T00:00:00Z" },
        "results": [{
            "totalPrice": 500000
        }]
    },
    {
        "interval": { "start": "2015-02-02T00:00:00Z", "end": "2015-02-03T00:00:00Z" },
        "results": [{
            "totalPrice": 150000
        }]
    },
    {
        "interval": { "start": "2015-02-03T00:00:00Z", "end": "2015-02-04T00:00:00Z" },
        "results": [{
            "totalPrice": 25000
        }]
    }]
}
The following time intervals are supported:
- minutely
- hourly
- daily
- weekly
- monthly
- quarterly
- yearly
Time interval with group by
You can also combine a time interval with a group by in your query.
For example, to query daily total sales this month by country:
connect.query("purchases")
    .select({
        "totalPrice": { "sum": "price" }
    })
    .timeframe("this_month")
    .interval("daily")
    .groupBy("country")
    .execute()
    .then(function(result) {
        // Handle the result
    });
This would return a result like:
{
    "metadata": {
        "groups": ["country"],
        "interval": "daily",
        "timezone": null
    },
    "results": [{
        "interval": { "start": "2015-02-01T00:00:00Z", "end": "2015-02-02T00:00:00Z" },
        "results": [
            {
                "country": "Australia",
                "totalPrice": 100000
            },
            {
                "country": "Italy",
                "totalPrice": 100000
            },
            {
                "country": "United States",
                "totalPrice": 300000
            }
        ]
    },
    {
        "interval": { "start": "2015-02-02T00:00:00Z", "end": "2015-02-03T00:00:00Z" },
        "results": [
            {
                "country": "Australia",
                "totalPrice": 25000
            },
            {
                "country": "Italy",
                "totalPrice": 25000
            },
            {
                "country": "United States",
                "totalPrice": 100000
            }
        ]
    },
    {
        "interval": { "start": "2015-02-03T00:00:00Z", "end": "2015-02-04T00:00:00Z" },
        "results": [
            {
                "country": "Australia",
                "totalPrice": 5000
            },
            {
                "country": "Italy",
                "totalPrice": 5000
            },
            {
                "country": "United States",
                "totalPrice": 15000
            }
        ]
    }]
}
Timezones
By default, Connect uses UTC as the timezone for queries with relative timeframes or time intervals. You can override this to be the timezone of your choice by specifying the timezone in your query.
You can only specify a timezone when you have specified a time interval and/or a relative timeframe. If you try to specify a timezone without one of these set, an error will be returned.
You can specify a numeric (decimal) value for an hours offset of UTC, for example:
connect.query("purchases")
    .select({
        "totalPrice": { "sum": "price" }
    })
    .timezone(10)
    .execute()
    .then(function(result) {
        // Handle the result
    });
You can also specify a string which contains an IANA time zone identifier, for example:
connect.query("purchases")
    .select({
        "totalPrice": { "sum": "price" }
    })
    .timezone("Australia/Brisbane")
    .execute()
    .then(function(result) {
        // Handle the result
    });
Error handling
Executing a query (via the execute() function) returns a promise (we use Q for our promises).
This means you should handle the failure of that promise if you wish to catch any errors. For example:
connect.query("purchases")
    .select({
        "itemsSold": "count",
        "totalPrice": { "sum": "price" }
    })
    .execute()
    .then(function(result) {
        // Handle the successful result

    })
    .catch(function(err) {
        // Handle the error

        console.log("HTTP status: " + err.status);
    });
The following error responses may be returned from the API:
422 Unprocessable Entity
The query was not in the correct format. The message body will contain a list of errors, for example:
{
    "errors": [
        {
            "field": "query",
            "description": "The query JSON supplied is not valid."
        }
    ]
}
413 Too Many Results
Queries result sets are limited to 10,000 results. If you exceed this threshold, you will receive this error.
Ideally, queries should return a small number of results, even if they are aggregating a large number of events. You should reconsider the way in which you are querying if you are hitting this limit.
500 Internal Server Error
An internal server error occurred in the Connect API.
Manipulating results client-side
You can manipulate the result set client-side after executing one or more queries to perform calculations or join multiple queries together.
By chaining promises together, you can maintain a single promise which returns the desired result set, which will easily plug into the visualization library.
Note: Before you modify a result set, it is important to clone the result set first to ensure other forks of the original promise are not modified. The SDK provides a simple clone function to assist with this.
For example, perhaps you want to calculate the gross profit of your sales:
var resultsPromise = connect.query("purchases")
    .select({
        totalSales: { "sum": "price" },
        totalCost: { "sum": "cost" }
    })
    .timezone('Australia/Brisbane')
    .execute();
    .then(function (results) {
        var newResults = results.clone();

        for (var i = 0; i < newResults.results.length; i++)
            newResults.results[i].grossProft = newResults.results[i].totalSales - newResults.results[i].totalCost;

        return results;
    });
Your resultsPromise can now be passed to the visualization library and will be treated
as if it is a standard query.
In fact, promises are entirely loosely-coupled to queries - you can construct your own promise that returns a valid
result set with metadata and results.
This means you can combine multiple queries, augment results with data from other services or perform complex calculations client-side.
Exporting events
Currently, this SDK does not support exporting events.
However, you can use HTTP API to perform exports as required.
Visualizing data
To start visualizing data with our visualizations, you must ensure you have first included the viz library.
If you are using the CDN or Bower, make sure you've referenced the library and CSS file.
For NPM, make sure you've installed the connect-js-viz package and referenced the library and the CSS
(via Browserify or through other means).
Once this is correctly installed, you can start creating visualizations, for example:
See the Pen Connect Text viz by Connect (@getconnect) on CodePen.
Creating visualizations
To create a viz, you must provide:
You may also supply:
- options to configure the behavior and appearance of the visualization.
To create a new visualization you call the visualize(query) method on either Connect itself or an instance of Connect.
For example, to visualize a chart:
var query = connect.query('purchases')
    .select({
        totalSales: { sum: 'purchasePrice' }
    })
    .groupBy('product')
    .interval('monthly');

var chart = Connect.visualize(query)
    .as('chart')
    .inside('#chart')
    .draw();
By using the metadata from the result set, visualizations automatically map the query results to various elements. For example, chart visualizations will automatically decide how to map groups, time series and aggregations to its axes or series.
Note. You should also be mindful of the viz lifecycle so you can refresh, update or destroy visualizations as required.
Query
When creating a visualization builder with the visualize(query) method you can specify either a query generated by connect.query or a function that returns a promise
(of a valid result set).
Specifying a function that returns a promise can be useful if you want to chain promises and run your own custom calculations on the result set or combine it with other services' data. For example:
var query = connect.query('purchases')
    .select({
        totalSales: { sum: 'purchasePrice' }
    })
    .groupBy('product')
    .interval('monthly');

var resultsFactory = function() {
  return query.execute()
    .then(function (results) {
        var newResults = results.clone();
        // modify the new results
        return newResults;
    });
}

var chart = Connect.visualize(resultsFactory)
    .as('chart')
    .inside('#chart')
    .with({
        title: 'Total Sales by Product Monthly'
    })
    .draw();
Viz type
You specify the viz type by calling the as(vizType) method on the visualization builder.
You need to provide the name of the viz type you want to use as a string.
| Name | Reference |
|---|---|
| chart | Bar charts, Line charts etc. |
| text | Text |
| table | Table |
| guage | Gauge |
The viz type can also be the name of any registered custom visualizations.
Container
You specify the container by calling the inside(container) method on the visualization builder.
The container can either be a reference to a HTMLElement or the id of the HTML element as a string.
Your HTML element you provide as a container must have an explicit height for the visualization to display correctly.
Options
You specify the options by calling the with(options) method on the visualization builder.
The options for a viz contains field options, interval options (if applicable) and any specific options related to the viz type. For example:
{
    fields: { /* field options */ },
    intervals: { /* interval options */ },
    chart: { /* chart specific options */ },
    gauge: { /* gauge specific topions */ }
}
Basic visualizations
Connect offers a range of pre-built basic visualizations which you can use to visualize data. You can also build your own.
All visualizations support the setting of field options and interval options (if applicable).
Table viz
See the Pen Connect Table viz by Connect (@getconnect) on CodePen.
The table viz will display your results in a tabular fashion. This is best used with grouped or time interval queries, which get displayed as multiple rows.
You can also apply the following CSS classes to your viz's container to change the styling and/or behavior of the table:
connect-table-fixed-header- enable scrolling of the table and ensure that the header remains fixed (using pure CSS).connect-table-striped- enable "zebra striped" styling of the table.connect-table-hover- changes a row's background color when hovering over it.connect-table-solid-header- display the table header with a solid background color.
The actual styling/colors used can be overridden using CSS, or you can specify custom LESS variables and build the SDK yourself.
Text viz
See the Pen Connect Text viz by Connect (@getconnect) on CodePen.
The text viz will display a single result in simple text. You can add a title and specify the format via the options.
You cannot create a text viz for queries with groups or time intervals - doing so will display an "unsupported query" error on the visualization.
Chart visualizations
Connect offers a range of pre-built chart visualizations which you can use to visualize data. You can also build your own.
See chart options for information on how to customize these charts. All visualizations also support the setting of field options and interval options (if applicable).
Bar chart
See the Pen Connect Bar Chart viz by Connect (@getconnect) on CodePen.
You can generate a bar chart for queries by specifying type: 'bar' on the options for a chart visualization.
Bar charts are great for showing discrete data, such as with single or multiple grouped queries. While you can display time interval queries with a bar chart, it is highly recommended to use line charts instead.
Line charts
See the Pen Connect Line Charts by Connect (@getconnect) on CodePen.
You can generate a line chart for grouped or time interval queries by specifying one of the following type values on the options for a chart visualization:
linesplineareaarea-splinesteparea-step
In the above example, all area charts specify stack: true in the options to provide a stacked area chart. Also, the switch between the various chart types
makes use of the destroy() method to clean up (documented here).
Chart options
All charts allow you to specify various options to customize their appearance and behavior:
var chart = Connect.visualize(query)
    .as('chart')
    .inside('#chart')
    .with({
        chart: {
            type: 'bar',
            colors: ['#3498db', '#34495e', '#e74c3c'],
            showLegend: true,
            padding:{
                top: 5,
                right: 10,
                bottom: 5,
                left: 10
            },
            yAxis: {
                format: '$,.2f',
                startAtZero: true,
                min: null,
                max: null
            },
            stack: true
        }
    })
    .draw();
| Property | Type | Description |
|---|---|---|
type |
string |
Type of chart to display (one of either bar, line, area, spline, area-spline, step, area-step) |
colors |
string[] or function |
An array of colors to use as a palette for the chart. Or a function to provide more granular control. See Chart colors for more info. |
showLegend |
boolean |
Specify whether or not to show the legend. By default true, but false with a single aggregation and no group by/interval. |
padding |
object |
The padding around the gauge (left, right, top and bottom). By default, { left: 0, right: 0, bottom: 0, top: 0 } |
yAxis.format |
string or function |
Either a format string, or alternatively a function accepting a single value argument that returns a formatted string. See Formatters for more info. |
yAxis.startAtZero |
boolean |
Specifically for area, area-spline, area-step and bar, this specifies whether or not the Y-axis min value will default to zero, or automatically calculate based on the data. By default, this is true. |
yAxis.min |
number |
An explicit minimum value for the Y-axis (this overrides startAtZero in all instances). |
yAxis.max |
number |
An explicit maximum value for the Y-axis. |
stack |
boolean |
For all chart types except bar, whether or not to stack multiple series. |
Chart colors
There are multiple ways in which you can customize chart colors. If no colors are specified in chart options, the default palette is used.
You can override the palette by setting the colors property on the chart options with an array of colors. For example:
Connect.visualize(query)
    .as('chart')
    .inside('#sales-area')
    .with({
        title: 'Electric Car Sales 2018 (Units)',
        chart: {
            type: 'bar',
            colors: ['#ff00000', 'blue', 'rgb(0, 255, 0)']
        }
    })
    .draw();
Furthermore, you can provide a custom function to the colors property allowing complete control over the coloring on the chart. For example, you may
want specific groups in your data to be the same color across multiple charts to allow users to correlate data by color:
var manufacturerColors = function(context) {
    if (!context.groupBys)
        return;

    switch (context.groupBys['manufacturer']) {
        case 'Tesla':
            return 'rgb(155, 89, 182)';
        case 'Toyota':
            return 'rgb(26, 188, 156)';
        case 'GM':
            return 'rgb(231, 76, 60)';
        case 'Nissan':
            return 'rgb(243, 156, 18)';
        case 'Ford':
            return 'rgb(52, 152, 219)';
    }
};

Connect.visualize(query)
    .as('chart')
    .inside('#sales-bar')
    .with({
        title: 'Electric Car Sales 2018 (Units)',
        chart: {
            type: 'bar',
            colors: manufacturerColors
        }
    })
    .draw();

Connect.visualize(intervalQuery)
    .as('chart')
    .inside('#sales-area')
    .with({
        title: 'Electric Car Sales 2018 (Units)',
        chart: {
            type: 'area-spline',
            colors: manufacturerColors
        }
    })
    .draw();
The function that you provide to the colors property accepts a single context argument and should return a color as a string.
It will be called for each separate component of the chart, each time the context parameter will contain the unique combination of select and groupBys that a color is required for.
The context object has the following structure:
| Property | Type | Description |
|---|---|---|
select |
string |
The alias given to the aggregation you selected in the query. |
groupBys |
object |
An object containing the requested groupBy value keyed by the groupBy name specified in the query. |
Note. When a legend is visible on a chart and a groupBy is defined on the query. The colors function will be called to define a color for each legend item, as the legend item is only related to the select the groupBys property will be null in that specific context.
Gauge visualization
See the Pen Connect Gauge viz by Connect (@getconnect) on CodePen.
Gauge visualizations can be generated for basic queries. You cannot create a gauge viz for queries with groups or time intervals - doing so will display an "unsupported query" error on the visualization.
Gauge options
As well as the setting of field options (which all visualizations support), you must specify gauge options to configure the viz:
var gauge = Connect.visualize(query)
    .as('guage')
    .inside('#gauge')
    .with({
        gauge: {
            min: 0,
            max: 'total'
            color: '#2980b9',
            padding:{
                top: 5,
                right: 10,
                bottom: 5,
                left: 10
            },
            label: {
                format: '$,.2f'
            }
        }
    })
    .draw();
| Property | Type | Description |
|---|---|---|
min |
string or number |
Specifies the minimum value of the chart. This can either be a string name of a field in a resultset, or a static number. |
max |
string or number |
Specifies the maximum value of the chart. This can either be a string name of a field in a resultset, or a static number. |
color |
string |
The color of the data arc of the gauge. |
padding |
object |
The padding around the gauge (left, right, top and bottom). |
label.format |
string or function |
Either a format string, or alternatively a function accepting a single value argument that returns a formatted string. See Formatters for more info. |
Field options
All visualizations allow specifying field options which describe the way in which aggregated values and grouped fields are displayed in the viz.
Field options are keyed by select or grouped field, for example:
var query = connect.query('purchases')
    .select({
        totalSales: { sum: 'purchasePrice' }
    })
    .groupBy('product');

var chart = Connect.visualize(query)
    .as('chart')
    .inside('#chart')
    .with({
        chart: {
            type: 'bar'
        },
        fields: {
            totalSales: {
                label: 'Total Sales ($)',
                format: '$,.2f'
            },
            product: {
                label: 'Products',
                format: function(value){
                    return value === 'Some product name' ? 'Ours' : value;
                }
            }
        }
    })
    .draw();
| Property | Type | Description |
|---|---|---|
label |
string |
A "friendly" label for the select or grouped field. This may be displayed in a legend, tooltip, etc. depending on the viz type. |
format |
string or function |
Either a format string, or alternatively a function accepting a single value argument that returns a formatted string. See Formatters for more info. |
Formatters
Many of the viz types allow you to pass either a format string or a format function that converts a number to its string representation. When you pass a format string the d3 format function is used. You can find the d3 formatting specifictaions here. An example of providing a format string:
var fieldOptions = {
    totalSales: {
        //...
        format: '$,.2f'
    }
};
If you wish to have complete control over the formatting, you can provide your own format function. The function must accept a value as an argument and return the formatted string. This gives you the ability to use other third-party libraries for formatting. For example, you could format currency values using Numeral.js:
var currencyFormatter = function (value){
    return numeral(value).format('$0.0a');
};

var fieldOptions = {
    totalSales: {
        //...
        format: currencyFormatter
    }
};
Interval options
All visualizations allow specifying interval options when executing a query with time intervals. This controls the formatting of title labels (i.e. in the table viz) and labels for the interval values themselves.
| Property | Type | Description |
|---|---|---|
label |
string |
A "friendly" label or title for the interval. This only applies to the table viz (for the column heading). |
format |
string, object or function |
Either a moment.js format string, an object keyed by time interval with moment.js format strings or a function taking the start and optionally the end date of an interval and returning a formatted string. |
The simplest way to format the date for an Interval is to set the format property with a moment.js format string. For example:
var query = connect.query('purchases')
    .select({
        totalSales: { sum: 'purchasePrice' }
    })
    .groupBy('product')
    .interval('monthly');

var table = Connect.visualize(query)
    .as('table')
    .inside('#table')
    .with({
        title: 'Product Sales by Month',
        intervals: {
            label: 'Month',
            format: 'MMM YYY'
        }
    })
    .draw();
Your options may be used with different queries that have different intervals. If you wish to override the format for specific intervals you can supply the format property with an object that contains moment.js format strings keyed by time interval. For example:
var query = connect.query('purchases')
    .select({
        totalSales: { sum: 'purchasePrice' }
    })
    .groupBy('product')
    .interval('monthly');

var table = Connect.visualize(query)
    .as('table')
    .inside('#table')
    .with({
        title: 'Product Sales by Month',
        intervals: {
            label: 'Month',
            format: {
                monthly: 'MMM YYYY',
                yearly: 'YY'
            }
        }
    })
    .draw();
Alternatively, if you would like full control over formatting, you can provide the format property with a function that accepts a start date and optionally an end date as arguments and returns a formatted string.
Both the start date and optional end date arguments will be native JavaScript date objects.
For example:
var query = connect.query('purchases')
    .select({
        totalSales: { sum: 'purchasePrice' }
    })
    .groupBy('product')
    .interval('monthly');

var table = Connect.visualize(query)
    .as('table')
    .inside('#table')
    .with({
        title: 'Product Sales by Month',
        intervals: {
            label: 'Month',
            format: function (startValue) {
                return startValue.toString();
            }
        }
    })
    .draw();
Visualization lifecycle
After you have created a viz, you should manage its lifecycle in your app, including refreshing the data, updating or destroying it.
Refreshing visualizations
If you wish to refresh the data in a viz (i.e. execute the query again for fresh data), you can call the refresh() function
on the created viz. For example:
var chart = Connect.visualize(query)
    .as('chart')
    .inside('#chart')
    .draw();
//...
chart.refresh();
Many visualizations support smooth transitions/animations when data is refreshed. You may also wish to refresh visualizations on a timer to simulate streaming, real-time data.
The loading animation will not be shown when refreshing visualizations. You should update the viz if you wish this to display.
Updating visualizations
You can also update visualizations with a new query or function returning a promise by calling the update() function on the created
viz. This is useful in scenarios, for example, where an end user changes a filter. For example:
var chart = Connect.visualize(query)
    .as('chart')
    .inside('#chart')
    .draw();
//...
chart.update(newQuery);
The loading animation will be shown when updating visualizations and any pending queries for the viz will be cancelled/overridden by this action.
Destroying visualizations
If a viz is no longer needed in your app, or it needs to be completely replaced with a newly created one, it is important that you clean up the viz.
Simply removing the viz from the DOM is not sufficient and may cause memory leaks in your app.
To destroy a viz, simply call the destroy() function on the created viz. For example:
var chart = Connect.visualize(query)
    .as('chart')
    .inside('#chart')
    .draw();

chart.destroy();
Custom visualizations
You can register your own custom visualizations to take advantage of the regular viz lifecycle which the included visualizations use. This means your viz will automatically handle:
- Loading animations
- Handle queries or functions that return promises
- Handling out of order query results returned from the API
- Refreshing/updating
- Destruction
- Error handling
For example:
See the Pen Connect Custom viz by Connect (@getconnect) on CodePen.
A custom viz should supply an implementation for the following contract:
init(container, options) (optional)
This function is only called during initialization and should implement any initial DOM rendering before the query results have been received. Any changes to the DOM during this method will appear even while the loading animation is displayed over the top.
render(container, results, options, wasQueryUpdated)
This function is called whenever a new result set is available. The bulk of the viz rendering logic should be in this
function. results contains the standard result set returned from a query (including metadata).
wasQueryUpdated will indicate whether or not this is a mere refresh or whether the entire result set has changed
(e.g. due to a completely different query). This function is not optional, if it is not provided the custom viz will not be registered.
redraw() (optional)
This function is called when the redraw function is manually called on a viz. This should be defined if the
viz must manually respond to changes in the size of the viz container. The redraw function is commonly
used if a viz has been initially rendered when its container is not visible.
destroy() (optional)
This function is called when the viz is being destroyed. Any DOM elements will be removed automatically; however, you should define this function if any extra "clean up" is required (e.g. removing listeners, freeing objects, etc.)
defaultOptions() (optional)
This function is called when the viz is being first created, before init is called. If your vizualization needs some default options you should return them here as an object. The options that are passed to both init and render will be a union of any default options returned here and the options provided when the custom vizualization is instantiated. User provided options will take precedence over default options.
isSupported(metadata, selects) (optional)
Not all visualizations can handle all types of results. For example, the text viz, cannot handle query results with groups or time intervals. In these cases, the viz will gracefully display a "query not supported" error.
You can include your own logic as to whether your custom viz can support the specified metadata and selects by returning a boolean for this function.
The metadata argument will be the metadata returned by a query (which is defined here. metadata) The selects argument will be an array of the aliases given to the aggregations selected in the query.
By default, if no function is provided, all types of query results are assumed to be supported.
cssClasses(options) (optional)
This function is called when the viz is being first created, before init is called. The provided function should return an array of strings that will then be added to the target element of the visualization as classes. This is usefull for dynamically setting class names based on the options provided. There are also a few useful predefined CSS classes you can add to change the styling behavior of the viz:
grow-results- grow the viz's height to fill the entire available height.center-results- center the viz's results vertically.
Once you have implemented the contract, you register the custom viz using Connect.registerViz, for example you could provide an object that contains the appropriate functions:
Connect.registerViz('myViz', {
    init: function(container, options) {

    },
    render: function(container, results, options, hasQueryUpdated) {

    }
});

// The custom viz can then be used in the same manner as the built in ones.

Connect.visualize(query)
    .as('myViz')
    .inside('#custom-viz')
    .draw();
Or alternatively if you can provide the Connect.registerViz with a factory function. As an example if you using ES6 and classes you might do the following:
class MyViz {

    init(container, options) {

    }

    render(container, results, options, hasQueryUpdated) {

    }

}

Connect.registerViz('myViz', () => new MyViz);

// The custom viz can then be used in the same manner as the built in ones.

Connect.visualize(query)
    .as('myViz')
    .inside('#custom-viz')
    .draw();
Deleting collections
Currently, this SDK does not support deleting collections.
However, you can use the one of the following methods to delete collections if required:
Projects and keys
Connect allows you to manage multiple projects under a single account so that you can easily segregate your collections into logical projects.
You could use this to separate analytics for entire projects, or to implement separation between different environments (e.g. My Project (Prod) and My Project (Dev)).
To start pushing and querying your event data, you will need both a project ID and an API key. This information is available to you via the admin console inside each project under the "Keys" tab:
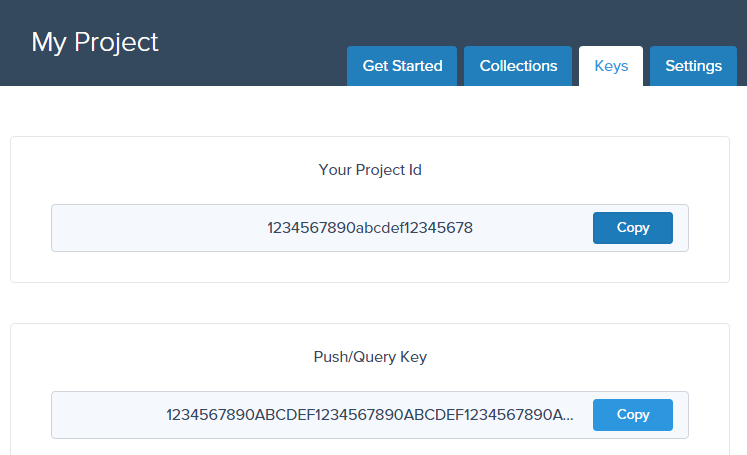
By default, you can choose from four different types of keys, each with their own specific use:
Push/Query Key- you can use this key to both push events and execute queries.
You should only use this key in situations where it is not possible to isolate merely pushing or querying.Push Key- you can only use this key to push events.
You should use this key in your apps where you are tracking event data, but do not require querying.Query Key- you can only use this key to execute queries.
You should use this key in your reporting interfaces where you do not wish to track events.Master Project Key- you can use this key to execute all types of operations on a project, including pushing, querying and deleting collections.
Keep this key safe - it is intended for very limited use and definitely should not be included in your main apps.
You must use your project ID and desired key to begin using Connect:
var Connect = require('connect-js');

var connect = new Connect({
    projectId: 'YOUR_PROJECT_ID',
    apiKey: 'YOUR_API_KEY'
});
Security
Security is a vital component to the Connect service and we take it very seriously. It is important to consider how to ensure your data remains secure.
API Keys
API keys are the core security mechanisms by which you can push and query your data. It is important to keep these keys safe by controlling where these keys exist and who has access to them.
Each key can either push, query or both. The most important key is the Project Master Key which can perform all of
these actions, as well as administrative functions such as deleting data. Read more about the keys here.
Keeping API Keys Secure
You should carefully consider when and which API keys to expose to users.
Crucially, you should never expose your Project Master Key to users or embed it in client applications.
If this key does get compromised, you can reset it.
If you embed API keys in client applications, you should consider these keys as fully accessible to anyone having access to that client application. This includes both mobile and web applications.
Pushing events securely
While you can use a Push Key to prevent clients from querying events, you cannot restrict the collections or events
clients can push to the API. Unfortunately, this is the nature of tracking events directly client-side and opens the
door to malicious users potentially sending bad data.
In many circumstances, this is not an issue as users can already generate bad data simply by using your application in an incorrect way, generating events with bad or invalid data. In circumstances where you absolutely cannot withstand bad event data, you should consider pushing the events server-side from a service under your control.
Finally, if a Push Key is compromised or being used maliciously, you can always reset it by resetting the master key.
Querying events securely
To query events, you must use an API key that has query permissions. By default, a Query Key has full access to all
events in all collections in your project. If this key is exposed, a client could execute any type of query on your
collections.
You have a number of options on querying events securely:
For internal querying or dashboard, you may consider it acceptable to expose the normal
Query Keyin client applications. Keep in mind that this key can execute any query on any collection in the project.Generate a filtered key, which applies a specific set of filters to all queries executed by clients with the key.
Only allow clients to execute queries via a service you control, which in turn executes queries via the Connect API server-side.
Finally, if a Query Key is compromised or being used maliciously, you can always reset it by resetting the master key.
Resetting the master key
Resetting the Project Master Key will invalidate the previous key and generate a new, random key. This action will also
reset all other keys for the project (including the push, query and any filter keys generated).
Doing this is irreversible and would prevent all applications with existing keys from pushing to or querying the project.
You can only reset the master key in the projects section of the admin console.
Filtered keys
Filtered keys allows you to create an API key that can either push or query, and in the case of querying, apply one or more filters to all queries executed with the key.
This allows you to have finer control over security and what data clients can access, especially in multi-tenant environments.
Filters are only applied to queries
Any filters specified in your filtered key only apply to querying. We currently do not support applying filters to restrict the pushing of events.
Filtered keys can only push or query (as you specify), never administrative functions or deleting data.
Generating a filtered key
Filtered keys are generated and encrypted with the Project Master Key. You do not have to register the
filtered key with the Connect service.
It is important that you never generate filtered keys client-side and always ensure the are generated by a secure, server-side service.
Create a JSON object describing the access allowed by the key, including any filters, for example:
{
    "filters": {
        "customerId": 1234
    },
    "canQuery": true,
    "canPush": false
}
Property Type Description filtersobjectThe filters to apply all queries executed when using the key. This uses the same specification for defining filters when querying normally. canQuerybooleanWhether or not the key can be used to execute queries. If false, thefiltersproperty is ignored (as it does not applying to pushing).canPushbooleanWhether or not the key can be used to push events. Serialize the JSON object to a string.
Generate a random 128-bit initialization vector (IV).
Encrypt the JSON string using AES256-CBC with PKCS7 padding (128-bit block size) using the 128-bit random IV we generated in the previous step and the
Project Master Keyas the encryption key.Convert the IV and cipher text to hex strings and combine them (IV first, followed by the cipher text), separating them with a hyphen (-). The resulting key should look something like this:
5D07A77D87D5B20FA5508303F748A43B-DDFA284A9341068A704A846E83ACF49069D960632C4F74A44B5EE330073F79A8324ADC91023F88F63AAE4507F3D119B5C7F31A2D7D9616408E9665EC6C1DEBE3
You can now use this API key to either push events or execute queries depending on the canPush
and canQuery properties, respectively.
Finally, if a filtered key is compromised or being used maliciously, you can always reset it by resetting the master key.
Modeling your events
When using Connect to analyze and visualize your data, it is important to understand how best to model your events. The way you structure your events will directly affect your ability to answer questions with your data. It is therefore important to consider up-front the kind of questions you anticipate answering.
What is an event?
An event is an action that occurs at a specific point in time. To answer "why did this event occur?", our event needs to contain rich details about what the "world" looked like at that point in time.
Put simply, events = action + time + state.
For example, imagine you are writing an exercise activity tracker app. We want to give users of your app the ability to analyze their performance over time. This is an event produced by our hypothetical activity tracker app:
{
    "type": "cycling",
    "timestamp": "2015-06-23T16:31:56.587Z",
    "duration": 67,
    "distance": 21255,
    "caloriesBurned": 455,
    "maxHeartRate": 182,
    "user": {
        "id": "638396",
        "firstName": "Bruce",
        "lastName": "Jones",
        "age": 35
    }
}
Action
What happened? In the above example, the action is an activity was completed.
In most circumstances, we group all events of the same action into a single collection.
In this case, we could call our collection activityCompleted, or alternatively, just activity.
Time
When did it happen? In the above example, we specified the start time of the activity as the value of the timestamp property. The top-level timestamp property is a special property in Connect. This is because time is an essential property of event data - it's not optional.
When an event is pushed to Connect, the current time is assigned to the timestamp property if no value was provided by you.
State
What do we know about this action? What do we know about the entities associated with this action? What do we know about the "world" at this moment in time? Every property in our event, besides the timestamp and the name of the collection, serves to answer those questions. This is the most important aspect of our event - it's where all the answers live.
The richer the data you provide in your event, the more questions you can answer for your users, therefore it's important to enrich your events with as much information as possible. In stark contrast to the relational model where you would store this related information in separate tables and join at query time, in the event model this data is denormalized into each event, so as to know the state of the "world" at the point in time of the event.
Collections
It is important when modeling your events to consider how you intend to group those events into collections. This is a careful balance between events being broad enough to answer queries for your users, while specific enough to be manageable.
In our activity example, the activity contains different properties based on what the type of activity. Our cycling activity contains properties associated with the bike that was used, while a kayaking activity may contain properties associated with a kayak that is used.
Because a kayaking event may have different properties to a running event, it might seem logical to put each of them in distinct collections. However, if we
had distinct cycling, running and kayaking collections, we would lose the opportunity to query details that are common to all activities.
As a general rule, consider the common action among your events and decide if the specific variants of that action warrant grouping those events together.
Structuring your events
Events have the following core properties:
- Denormalized
- Immutable
- Rich/nested
- Schemaless
It is also important to consider how to group events into collections to enable future queries to be answered.
Events are denormalized
Consider our example event again, notice the age property of the user:
{
    "type": "cycling",
    ...
    "user": {
        "id": "638396",
        "firstName": "Bruce",
        "lastName": "Jones",
        "age": 35
    }
}
The user's age is going to be duplicated in every activity he/she completes throughout the year. This may seem inefficient; however, remember that Connect is about analyzing. This denormalization is a real win for analysis; the key is that event data stores state over time, rather than merely current state. This helps us answer questions about why something happened, because we know what the "world" looked like at that point of time.
For example imagine we wanted to chart the average distance cycled per ride, grouped by the age of the rider at the time of the ride. We could simply execute the following query:
var query = connect.query('activity')
  .select({ averageDistance: { avg: 'distance' } })
  .groupBy('user.age');

var chart = connect.chart(query, '#chart', {
    title: 'Average distance per activity by age',
    chart: { type: 'bar' }
});
It's this persistence of state over time that makes event data perfect for analysis.
Events are immutable
By their very nature, events cannot change, as they always record state at the point in time of the event. This is also the reason to record as much rich information about the event and "state of the world" as possible.
For example, in our example event above, while Bruce Jones may now be many years older, at the time he completed his bike ride, he was 35 years of age. By ensuring this event remains immutable, we can correctly analyze bike riding over time by 35-year-olds.
Consider events as recording history - as much as we'd occasionally like to, we can't change history!
Events are rich and nested
Events are rich in that they specify very detailed state. They specify details about the event itself, the entities involved and the state of the "world" at that point in time.
Consider our example activity event - the top level type property describes something about the activity itself (a run, a bike ride, a kayak etc.). The user property specifies rich information about the actor who performed the event. In this case it's the person who completed the activity, complete with their name and age.
In reality, though, we may decide to include a few other nested entities in our event, for example:
{
    "type": "cycling",
    ...
    "user": {
        "id": "638396",
        "firstName": "Bruce",
        ...
    },
    "bike": {
        "id": "231806",
        "brand": "Specialized",
        "model": "S-Works Venge"
    },
    "weather": {
        "condition": "Raining",
        "temperature": 21,
        "humidity": 99,
        "wind": 17
    }
}
Note our event now includes details about the bike used and the weather conditions at the time of the activity. By adding this extra bike state information to our event, we have opened up extra possibilities for interrogating our data. For example, we can now query the average distance cycled by each model of bike that was built by "Specialized":
var query = connect.query('activity')
  .select({ averageDistance: { avg: 'distance' } })
  .groupBy('bike.model');
  .filter({
    'bike.brand': 'Specialized'
  });
The weather also provides us with exciting insights - what did the world look like at this point in time? What was the weather like? Storing this data allows us to answer yet more questions. We can test our hypothesis that "older people are less scared of riding in the rain" by simply charting the following query:
var query = connect.query('activity')
  .select({ averageDistance: { avg: 'distance' } })
  .groupBy(['user.age', 'weather.condition']);
As you can see, the richer and more denormalized the event, the more interesting answers can be derived when later querying.
Events are schemaless
Events in Connect should be considered semi-structured - that is, they have an inherent structure, but it is not defined. This means you can, and should, push as much detailed information about an event and the state of the "world" as possible. Moreover, this allows you to improve your schema over time and add extra information about new events as that information becomes available.
Restrictions
While you can post almost any event structure to Connect, there are a few, by-design restrictions.
Property names
You cannot have any property in the root document beginning with "tp_". This is because we prefix our own internal properties with this. Internally, we merge our properties into your events for performance at query time.
The property "_id" is reserved and cannot be pushed.
The properties "id" and "timestamp" have special purposes. These allow consumers to specify a unique ID per event and override the event's timestamp respectively. You cannot use the "id" property in queries. Refer to "reliability of events" and "timestamps" for information.
The length of property names can't exceed 255 characters. If you need property names longer than this, you probably need to reconsider the structure of your event!
Properties cannot include a dot in their names. This is because dots are used in querying to access nested properties. The following is an example of an invalid event property due to a dot in the name:
{
    "invalid.property": "value"
}
Arrays
While you can create events with arrays, it is currently not possible to take advantage of these arrays at query time. Therefore, you should avoid using arrays in your events unless you plan to export the raw events.
Distinct count
Distinct count is currently not supported for querying, therefore you should consider how to structure your event if your application relies on this.